Samples of the 60 charts
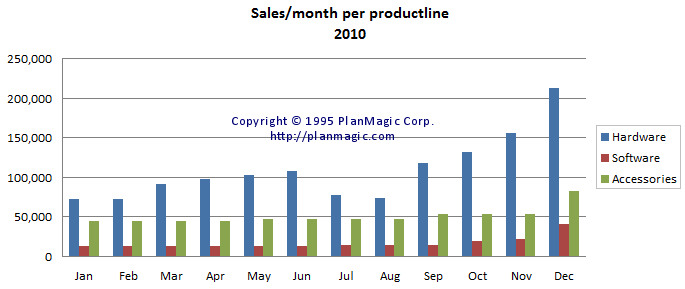
Displays the sales per month per product line during the first year.
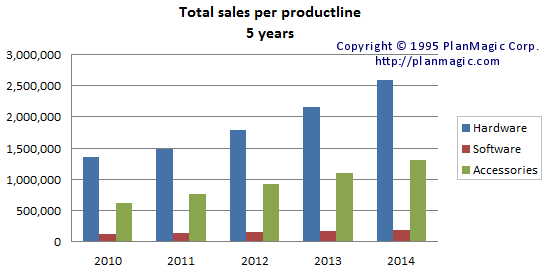
Displays the sales per product line for five years. Tables and charts for a three years projection are available as well.
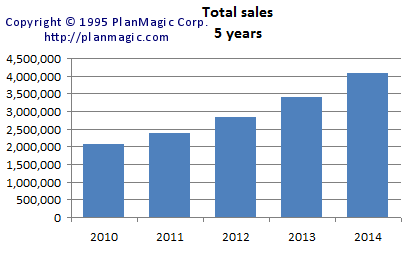
Displays the total sales for five years.
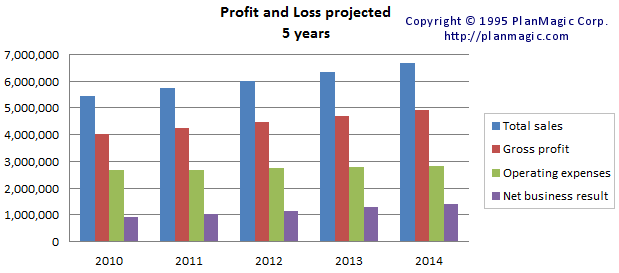
In the Profit and Loss projection there are charts for total revenue, gross profit, operating expenses and net business results for three and five years.
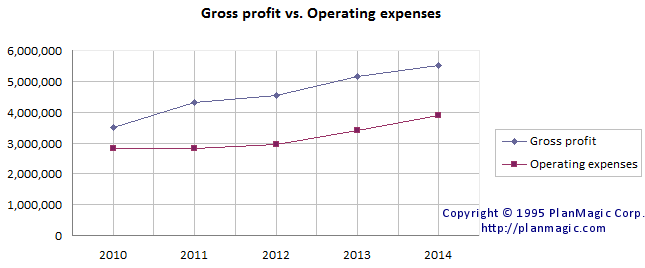
Displays the annual gross profit versus the total operating expenses. The point at which the gross profit line passes above the total expenses line is when your business will start making profit.
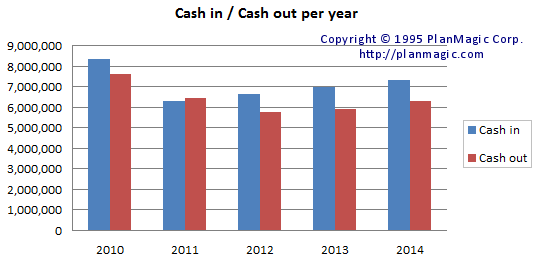
In the cash flow section, this chart displays the total cash in versus cash out per year.
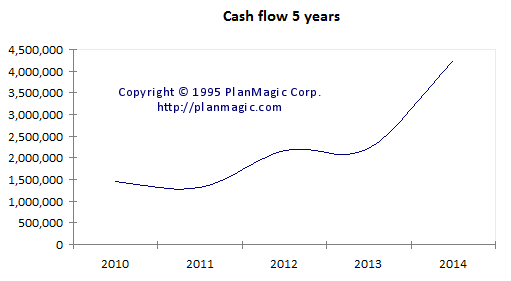
Displays your year ending cash position for each year. Also available is a detailed monthly position during the first three years.
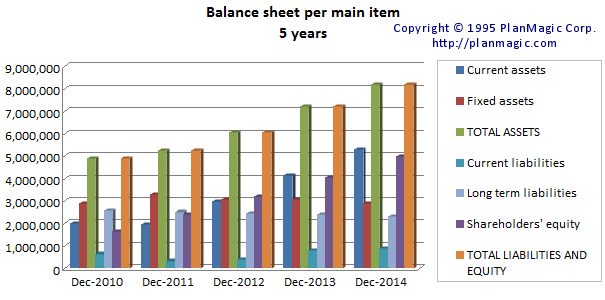
Displays the main items in your balance sheet projection during five years.